| << Back to Location Tab | Up to Contents | Ahead to Maintenance >> |
This tab shows the most recent qualification history for this location, if any is recorded, as well as any sensor data associated with it. This allows users to track the status of a location to determine whether it is suitable for their process.
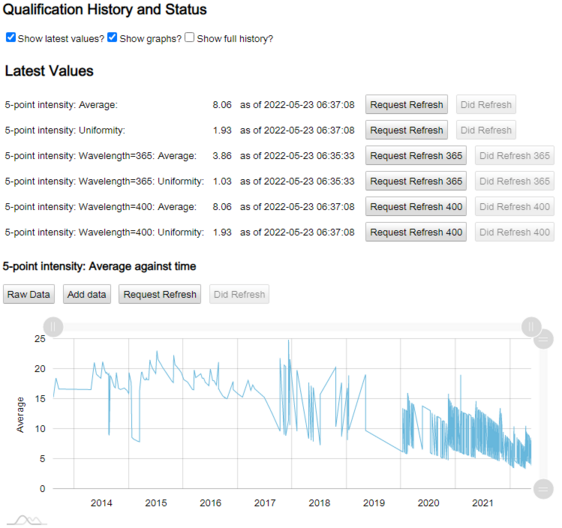
Which run data variables are plotted depends on the qual protocol. The information of greatest interest to users is the most recent measurement, so the default display shows the latest measurement of each variable that has a plot defined and when that maeasurement was taken. Request Refresh buttons are provided to allow users to request that a location be qualified, and for qual protocols that have no data to record (e.g. chemical baths) staff members can press a Did refresh button to indicate that the normal qualification has been made, e.g., the bath has been repoured.
If the box Show graphs? is checked at the top of the page, graphs will be displayed showing the value of each plotted variable over time. The charts are interactive but by default they only show the last 1000 data points; if more data are desired the user can request that ll data be shown by checking the Show full history? box.
Data may be downloaded from the Lab>Status tab, by pressing the Raw Data button. New entries may be added by pressing the Add data button.
| << Back to Location Tab | Up to Contents | Ahead to Maintenance >> |